The month of July, 2012. The month we released our first project ever, Amazing Brok. The lessons learned are coming hard and fast, but that’s for another post. This will be all about the numbers. So let’s get to it, shall we?
To start, I should briefly mention the setup. We released Brok on the Apple AppStore as a free app with limited content, and an in-app purchase for more. Currently there is only one level pack you can buy, priced at $.99. On Google Play, we have a paid app with all the levels, also for $.99. How well did that work out?
Downloads
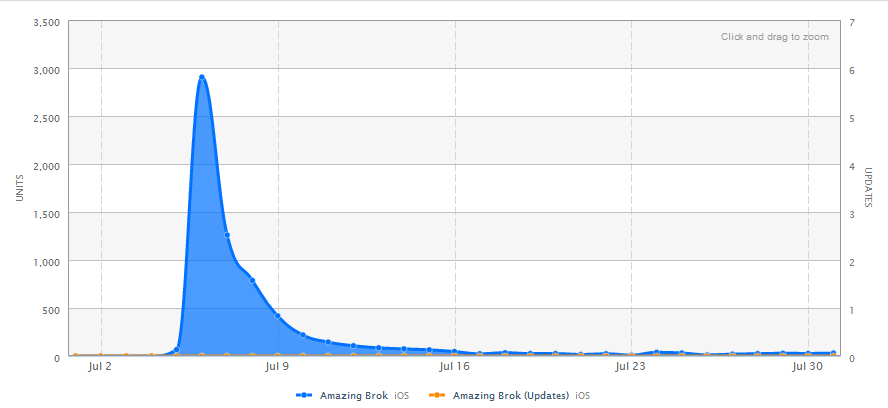
The huge spike is the initial release day, and it’s been slowly going down ever since. Total downloads for the month landed at 6616. For our first attempt ever, we’ve been pretty pleased with this number. Sure, we had no frame of reference. But still, we were fairly pessimistic at how many people would even see the game.
Sales
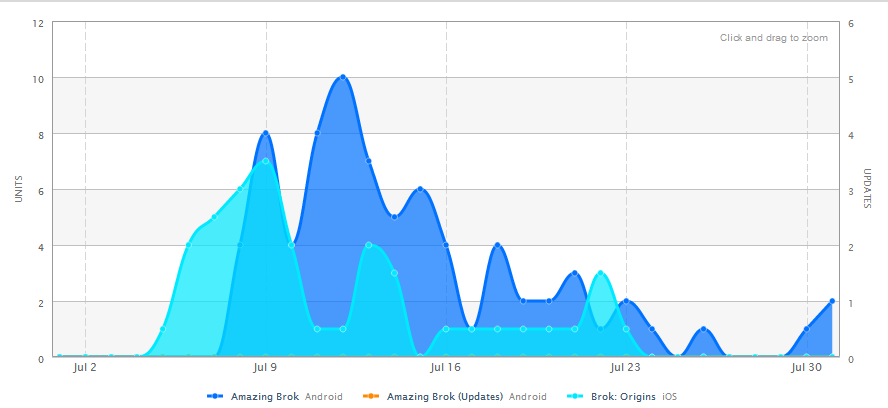
With such a small sample size, the graph isn’t exactly helpful. Other than showing that sales are going down roughly with downloads, not much can be gleaned. It’s maybe a bit interesting to note that a paid app for Android devices did much better than an in-app purchase for iOS. Total sales for both stores for the month were 122 units (76 for Android, 46 for iOS), for a total of $83.79.
Store Rankings
It may be relevant or interesting to some of you, so here are the ranking charts for the Apple and Play store separately.
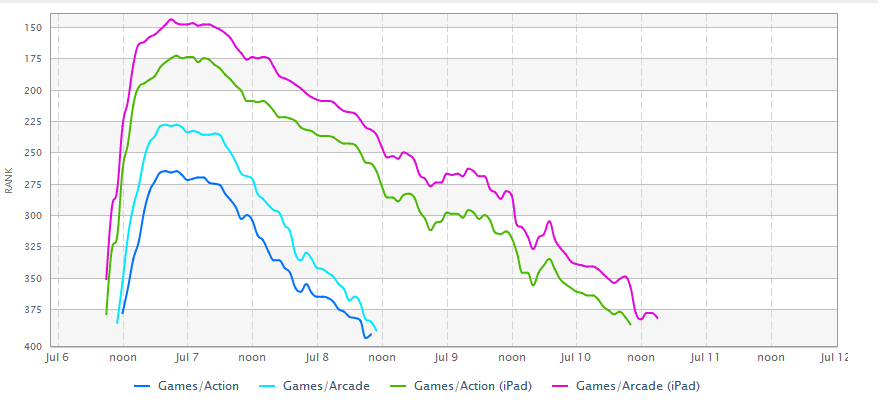
I shortened the time frame. After July 11, Brok doesn’t appear again in Apple’s store rankings. Here’s the Play store.
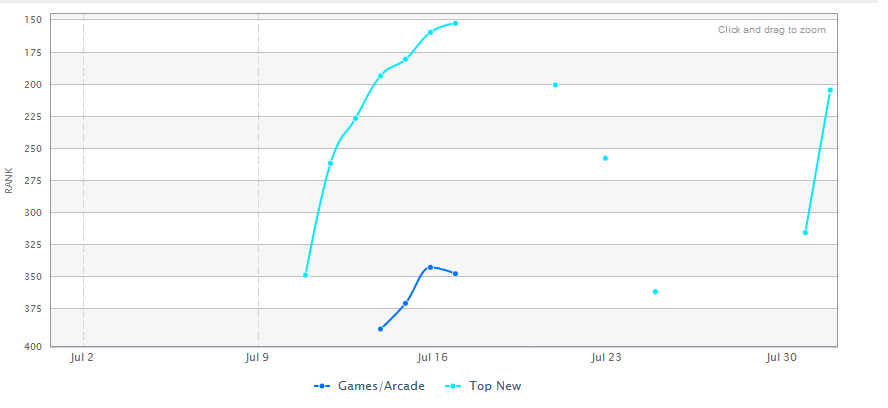
It seems like there is an issue with AppFigures collecting data from the Play store occasionally. It will sometimes go several hours without an update. I’m not sure if AppFigures fails to collect data, or if there’s an issue finding the rankings off the Play store. Either way, you can still see the plot points showing the declining curve after the 16th. That sudden spike at the end of the month is when I released an update (I’m still waiting for Apple to review that update for iOS devices).
Marketing
We’ve done practically zero marketing. I posted in a few subreddits, and told friends and family that the game was released. We haven’t spent any money on ads. We haven’t done any press releases. I haven’t emailed any review sites. It looks bad when I put it all together like that.
I do plan on emailing sites when I get the first update approved. That update really improves the levels, adds some graphical niceties, includes more free content, and more. The update gets the game closer to what we wanted to release. Once it’s approved and live, I’ll feel better about people reviewing the game.
That said, we have had 3 or 4 sites review the game already. They were small sites, but the reviews were favorable. I’m not sure if they helped with downloads or not.
Pirates
One fun thing to learn was the piracy rate. I knew it could be high; I’d heard numbers as high as 95%. Also, lots of posts had mentioned it being worse on Android than iOS. I’m not sure if that’s true or not. However, in this case it almost certainly has been. It’s a bit more difficult to set up the reasoning, but we saw a minimum of about 98% piracy of the Android version. Here’s my data.
We used CoronaSDK to build this app, which bakes in it’s own data collection code unless you explicitly turn it off. I decided to leave it in, since I could see the data via their dashboard and I was curious about what it would reveal (did I mention that this has been a major learning experience?). They collect a few pieces of data which interest me, but in this case I was looking at the number of unique daily users broken down by OS. (They claim it’s unique users, but my guess is that it’s really unique device IDs).
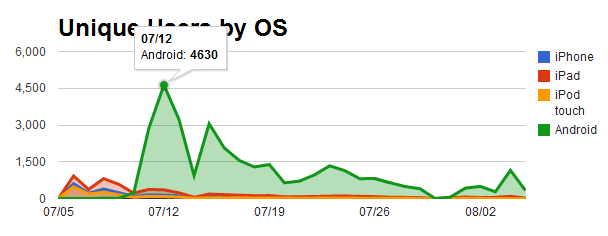
As you can see, at a high point we had 4630 unique devices playing Brok in a single day. That establishes a minimum number of Android devices that Brok could be on. All the other days’ users could just be a subset of the users from July 12. Some (slightly oversimplified) math shows us that 76 (legit users) / 4630 (min # of devices with Brok) = 1.64% legitimate users.
Now obviously it’s not quite that simple. There could have been legit users with multiple devices. Or pirates with multiple devices. Maybe I should be counting the number of units sold by July 12th, instead of using the total for the month. Lots of different ways you may want to look at the data. (I’m happy to oblige, btw, if you want a specific piece of data that I haven’t given here. Let me know in the comments).
Looking Forward
I’m considering releasing a second version of Brok on Play as a free app, with ads and an in-app purchase to remove those ads. I’m also considering putting the app on the Amazon AppStore for Android and Kindle Fire, as well as the Barnes & Noble store for Nook Color and Tablet. We’ll see what happens.
Closing
Despite the terrible sales, we have both been really stoked about the whole process. This is something I do in off-hours, so I’m not depending on the income for anything. My first milestone goal for the company is to just break even after the CoronaSDK license and developer fees, and I have 5 more months for that.
I intend to post a report every month about how we’re doing. I think that’s something people would like to see, especially other developers. Also, I’d love to hear any comments or criticisms you may have, about our overall approach, the game, this report, whatever. And thanks for reading!
Edit: Added in rankings data and marketing info as per user onewayout in /r/gamedev


